Stock Market Euphoria Continues; Dow Surpasses 16,000, S&P Jumps Above 1,800
Disclaimer: This article is for informational purposes only and should not be considered a solicitation to buy or sell any security or to engage in any asset allocation decisions. Please seek professional advice from your financial advisor who knows your individual needs and risk tolerances.
Key Takeaways
è Stock prices have become disconnected from current fundamentals, and euphoria in the stock market is running wild.
è We encourage investors to assess their exposure to small caps (equities with market capitalizations under $2 billion) and determine whether a price fall of 25% or more in coming years would be tolerable. Still, we’ll likely see higher prices for small caps before we see lower ones.
è The current forward 12-month P/E ratio (of S&P 500 companies) of 15 is above both the 5-year average (13.0) and the 10-year average (14.0). The P/E ratio has been above the 5-year average since January, while it has been above the 10-year average for the past ten weeks (Source: FactSet).
è Though the S&P 500 index trades below its 15-year average (16.2), the number is skewed by the “bubble” years of 1998-2001. Said differently, to include a time period of 1998-2001 when valuations were extreme to justify current equity prices, the evidence becomes overwhelmingly in favor of the equity markets being overvalued at present. However, that doesn’t mean that stock prices can’t become even more overvalued, which is why it’s still very important to stay engaged with the news flow of the equity markets.
è The Best Ideas portfolio is heavily exposed to the equity markets, but it still holds roughly a 25% cash position in the event that the market comes back down to reflect current fundamentals. We wouldn’t be surprised if 2014 is a much more volatile environment than 2013.
On Monday, the Dow Jones Industrial Average (^DJI) surpassed 16,000 for the first time in its storied history. The S&P 500 Index (SPY), a broader market index and one that is more representative of large-cap equity market performance, hit over 1,800 for the first time during Monday’s trading session. The S&P 500 index has advanced more than 25% so far this year on the back of expectations for just 2% top-line growth and 5% earnings expansion from underlying companies during calendar 2013, according to November 15 data from FactSet. For the market to do what it has done so far this year, we would have expected double-digit top- and bottom-line expansion from index participants.
Stock prices have become disconnected from current fundamentals, and euphoria in the stock market is running wild. We think the primary driver for this disconnect between current prices and underlying value is ongoing quantitative easing actions (bond buying) by the Federal Reserve, which we think in turn is bolstering expectations of future inflation. Since conventional wisdom indicates that stocks are the best hedge against inflation, asset flows continue to enter the equity markets (from other asset classes). In this year alone, investors have allocated $22 billion in new money to small cap mutual funds and ETFs – on track to be the biggest year for inflows ever.
That said, we’ve yet to see inflation impact the top-line of S&P 500 constituents in a large way—the 2% top-line growth rate in calendar 2013 is hardly worth writing home about. When we exclude the financials sector from calculations, where earnings growth is expected to be roughly 17% for calendar 2013 (according to data from FactSet), the 5% pace of earnings expansion for this year would be significantly lower. Such bottom-line performance would imply a much-normal year of stock-price returns for 2013—not at all should it have translated into the significant and rapid run-up the markets have experienced during the year.
Looking at calendar year 2014, revenue growth for S&P 500 companies is expected to be a modest 4.5%, while earnings expansion is forecast to come in at over 10%, led by more than 15% bottom-line expansion in the consumer discretionary sector (according to FactSet). Though we are generally positive on consumer discretionary equities (XLY) in the form of Best Ideas portfolio holdings Ford (F) and DirecTV (DTV), as examples, we’d need to witness a torrid acceleration in the growth of discretionary spending to hit the anticipated pace of bottom-line expansion for consumer discretionary companies, as a group.
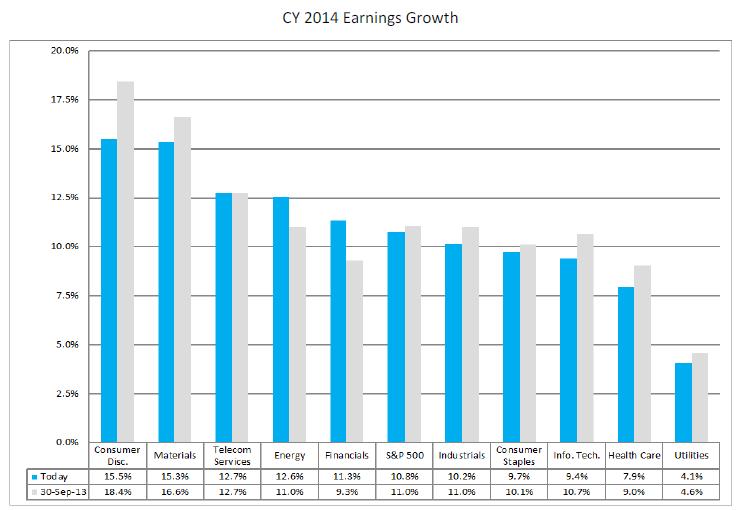
Image Source: FactSet
We think future fundamental expectations are getting ahead of themselves and prices are getting stretched as valuations try to match them. Leading the charge in the broader equity markets this year has been relatively low-quality small cap stocks (IWM), where according to this piece, the price-to-earnings multiple has expanded 25% in 2013 and now stands above 10-year averages in absolute terms and versus the S&P 500 (as measured by the P/E of the Russell 2000 Index, a proxy for small-cap stock performance). We encourage investors to assess their exposure to small caps (equities with market capitalizations under $2 billion) and determine whether a price fall of 25% or more in coming years would be tolerable. We think such a correction is likely, but in such an optimistic market, we’ll likely see higher prices for small caps before we see lower ones.
Though the market has benefited from investor euphoria this year, such activity should not have been unanticipated or viewed outside the realm of possibilities. One of the most important takeaways in the ’13 Steps to Understand the Stock Market’ is that the market is neither rational nor precise, as outlined below:
The Stock Market Is a Market. The stock market is made up of people. People make mistakes. People have biases. Some people are greedy; some people are fearful. The stock market is not a precise mechanism. If earnings of a company go up 10% in a year, for example, it is almost equally plausible that the same company's stock price may have gone down 10% or up 10% or stayed flat for that same year. The stock market is a market filled with individuals making decisions about what to buy or sell. And these buy and sell decisions move the stock price. We as individuals try to make rational what is not. We try to find complex answers for things even though at times they are so simple. In this case, the stock market is a market. And it doesn't get simpler than that. Key takeaway: The stock market is neither rational nor precise, and it is driven by the buy and sell decisions of participants (including your doctor, lawyer, shoe-shiner, and yes, even your taxi cab driver-or should I say, limo driver).
FactSet’s assessment of the market’s current valuation dynamics are quite intriguing, and we reproduce the firm’s thoughts below:
The current forward 12-month P/E ratio (of S&P 500 companies of 15) is above both the 5-year average (13.0) and the 10-year average (14.0). The P/E ratio has been above the 5-year average since January, while it has been above the 10-year average for the past ten weeks. With the forward P/E ratio well above the 5-year and 10-year averages, one could argue that the index may now be overvalued.
On the other hand, the current forward 12-month P/E ratio is still well below the 15-year average (16.2). During the first two to three years of this time frame (1998 – 2001), the P/E ratio was consistently above 20.0, peaking at around 25.0 at various points in time. With the forward P/E ratio still below the 15-year average and not close to the higher P/E ratios recorded in the early years of this period, one could argue that the index may still be undervalued.
It is interesting to note that the forward 12-month P/E ratio would be even higher if analysts were not projecting record-level EPS for the next four quarters.
Our belief is that the 5-year and 10-year averages are much more informative than the 15-year average, which is skewed by “bubble” performance during 1998-2001. Said differently, to include a time period of 1998-2001 when valuations were extreme to justify current equity prices, the evidence becomes overwhelmingly in favor of the equity markets being overvalued at present. However, that doesn’t mean that stock prices can’t get even more overvalued, which is why it’s still very important to stay engaged with the news flow of the equity markets.
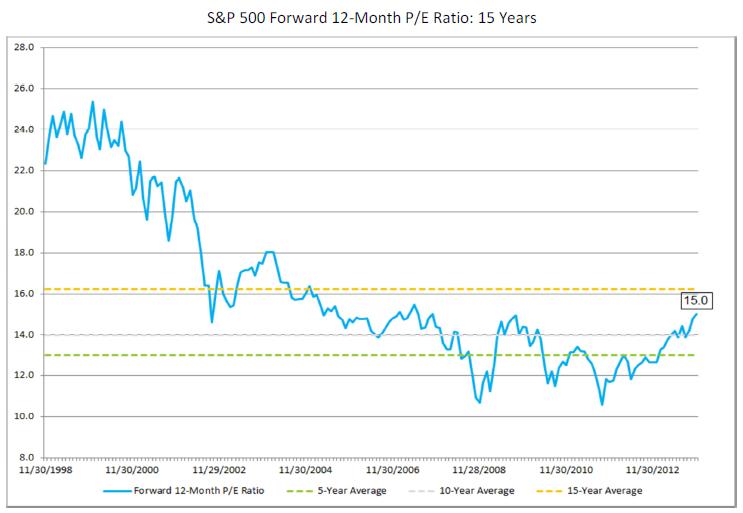
Image Source: FactSet
Wrapping It Up
It is how investors position themselves in euphoric times like this that makes all the difference to long-term returns. The Best Ideas portfolio remains heavily exposed to the equity markets, but it still holds roughly a 25% cash position in the event that the market comes back down to reflect current fundamentals. The portfolio holdings that are currently in the Best Ideas portfolio have done so well this year that the portfolio itself has kept pace with the market’s return, despite the large cash drag. This was not done by accident. We’ve positioned our portfolio to capture upside and limit potential downside exposure – in other words, the portfolio seeks to maximize returns while minimizing risk. We’re very pleased with the portfolio’s performance this year, and while we hope the good times will continue, we wouldn’t be surprised if 2014 is a much more volatile environment than 2013.