
By Brian Nelson, CFA
Within the discounted cash-flow [DCF] modeling process (also known as enterprise valuation, or the free cash flow to the firm model), there are two primary sources of cash-based intrinsic value: net cash on the balance sheet and future expected enterprise free cash flows. The sum of net cash on the balance sheet and the present value of future enterprise free cash flows divided by weighted average diluted shares outstanding results in a fair value estimate per share, which then can be divided by earnings to arrive at a value-derived price-to-earnings (P/E) ratio. Only when this value-derived P/E ratio is compared to the price-observed P/E ratio—the latter calculated as price divided by estimated earnings–can a company then be considered undervalued or overvalued.
It is not the absolute level of the price-observed P/E ratio that matters, but rather how the value-derived (DCF-derived) P/E ratio compares to the price-observed P/E ratio–or more simply, how the fair value estimate per share compares to a company’s price per share. P/E ratios, on an absolute basis (how high or low they are), have significant shortcomings when it comes to assessing valuation. Not only do they largely ignore the net cash position a company may have on the balance sheet, but they also ignore the long-term duration of future expected free cash flows. Stocks that have huge net cash positions on the balance sheet and tremendous future expected free cash flow generation tend to justifiably have comparatively high value-derived P/E ratios, while those that have huge net debt positions on the balance sheet and modest future expected free cash flows tend to have justifiably low value-derived P/E ratios.
Stocks such as Apple (AAPL), Microsoft (MSFT), and Alphabet (GOOG) (GOOGL), as just a few examples, deserve to have significantly higher valuation multiples. These companies have significant net cash on the balance sheet and strong expectations of future free cash flow. That’s why in part we’re huge fans of big cap tech and the stylistic area of large cap growth, even though many in these areas have above-market valuation multiples. On the other hand, many entities in the consumer staples (XLP) space may not necessarily deserve elevated multiples. As of July 28, FactSet estimates that the consumer staples sector has a forward estimated price-observed P/E ratio of more than 20 times. We’d expect entities with this multiple to have huge net cash positions and tremendous secular growth prospects, but while strong earnings growth may be achievable for some in this group, expansion expectations are modest by comparison.
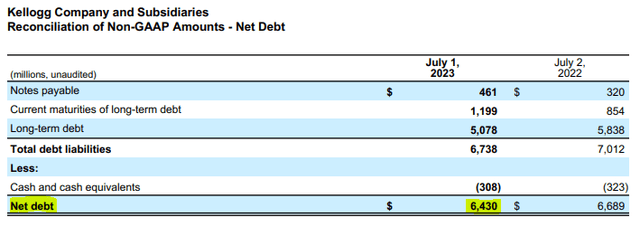
Image: Kellogg is representative of many consumer staples equities that have net debt positions. Image Source: Kellogg’s second-quarter press release
Let’s take Kellogg Company (K) as an example. The firm has total debt liabilities of ~$6.74 billion and just $308 million in cash (resulting in a net debt position of $6.43 billion), while its reported diluted earnings per share has fallen to $1.90 in the year-to-date period ending July 1, 2023, from $2.19 in the same period a year ago. On an adjusted basis, Kellogg’s earnings per share is expected to decline 1%-2% on a currency-neutral basis for the year while free cash flow so far in 2023 has also fallen due to weakening operating cash flow and higher capital spending.
Yet, shares of Kellogg are trading at 16x current-year’s expected earnings. If entities like Kellogg can garner a 16x multiple with their comparatively unattractive cash-based characteristics, what type of P/E multiple is then fair for a stock with a huge net cash position, substantial free cash flow generation, and tremendous secular growth prospects? Is it 30, 50, or more? That’s what the DCF helps solve. Clearly, we’re not interested at all in Kellogg’s shares (it has a poor Dividend Cushion ratio, too) at this time, nor will we have any interest in its pending breakup into two separate companies–its snacking business Kellanova and WK Kellogg Co, its North American Cereal business.
Most consumer staples equities are burdened with substantial net debt positions, while their long-term growth prospects are relatively muted. Their free cash flow generation may be robust, but most of their excess cash flow is absorbed by dividend liabilities that mitigate their capital appreciation potential. [Remember, when it comes to the payment of a dividend, the stock price is adjusted down by the payment on the ex-dividend date. The dividend is capital appreciation that otherwise would have been achieved had the dividend not been paid.] Clorox (CLX) has long-term debt of $2.48 billion and cash of $367 million. Long-term debt at Kraft Heinz (KHC) stands at $19.37 billion, while it has cash of $947 million. Debt, less cash and cash equivalents, at Colgate-Palmolive (CL) stands at $7.9 billion.
Though consumer staples equities have shown tremendous resilience in the face of adversity and their dividend yields can make sense in certain portfolios, the group is overflowing with net debt positions, meager long-term growth prospects, and free cash flow generation that is largely absorbed by growing per-share dividend liabilities. On the other hand, big cap tech and large cap growth have tremendous net cash positions and substantial future expected free cash flow generation, paving the way for what could be considerable long-term return potential. As with the last decade, we expect cash-based sources of intrinsic value to prevail, and for that, we continue to point to big cap tech and large cap growth as areas for consideration.
NOW READ — Questions for Valuentum’s Brian Nelson
NOW READ — ALERT: Big Yield Additions to Dividend Growth Newsletter Portfolio and High Yield Dividend Newsletter Portfolio
NOW READ — ALERT: Going to “Fully Invested” in the Best Ideas Newsletter Portfolio
NOW READ — Expect Huge Equity Returns This Decade, Much More Volatility However
NOW READ — There Are No Free ‘Income’ Lunches
———-

Tickerized for holdings in the XLP.
Brian Nelson owns shares in SPY, SCHG, QQQ, DIA, VOT, BITO, RSP, and IWM. Valuentum owns SPY, SCHG, QQQ, VOO, and DIA. Brian Nelson’s household owns shares in HON, DIS, HAS, NKE, DIA, and RSP. Some of the other securities written about in this article may be included in Valuentum’s simulated newsletter portfolios. Contact Valuentum for more information about its editorial policies.
Valuentum members have access to our 16-page stock reports, Valuentum Buying Index ratings, Dividend Cushion ratios, fair value estimates and ranges, dividend reports and more. Not a member? Subscribe today. The first 14 days are free.