Omega Healthcare and Holly Energy Partners: Case Studies in REIT and MLP Income Evaluation
An assessment of a REIT’s or MLP’s dividend/distribution strength not only should reflect firm-specific fundamentals, but also external market conditions, which are paramount to the sustainability of most any REIT’s or MLP’s payout. Let’s remind readers of this important dynamic, which is captured via the two different Dividend Cushion ratios, and walk through what goes into the analysis we pursue when making a change with respect to our assessment of a company’s dividend health or safety.
By Kris Rosemann and Brian Nelson, CFA
Real estate investment trusts (REITs) and master limited partnerships (MLPs) are not your typical operating companies. These business structures have certain provisions that incentivize lofty and growing dividends/distributions, which sounds good, but because these business models tend to also need access to outside equity or debt capital (more than the average corporate), there is no cookie cutter answer that completely captures the health of their respective dividends/distributions in one fell swoop. For example, if the equity or debt markets were to seize up, REITs and MLPs (AMLP) may come under tremendous pricing pressure due to their need for external capital. Just look at what happened to the Vanguard REIT ETF (VNQ) heading into the March 2009 panic bottom. It was a bloodbath.
Image shown: The performance of the Vanguard REIT ETF (VNQ) during the Financial Crisis in 2007-2009.
Because access to new capital is so important to these business models (and their stocks), we think the best way for readers to assess the sustainability of the payouts of REITs and MLPs is to examine a variety of information that considers different aspects of outside equity and credit market conditions. For example, under difficult equity and credit market conditions, looking at the unadjusted Dividend Cushion ratio, which we make available in the dividend report of each company we cover, may be a good starting point. The unadjusted Dividend Cushion ratio assumes that the path toward incremental new capital will be shut off, meaning the entity would have to rely on its own internally-generated free-cash-flow generation to meet growth and dividend/distribution obligations. In almost all cases with respect to REITs and MLPs, such entities need new capital to fund a combination of growth investment and the dividend/distribution.
In times of good credit like the “bubbly” environment of 2017, however, where capital and liquidity seem to be overflowing (just look at the performance of the price of Bitcoin), the adjusted Dividend Cushion, which assumes a trajectory of new capital issuance in the ratio, may make sense. If capital markets are open, meeting that dividend/distribution obligation may be much easier. Importantly, however, there is no easy shortcut to the dividend analysis of these complex business structures, and we encourage readers to go beyond the qualitative ratings and the two Dividend Cushion ratios, and evaluate the entirety of our dividend analysis on any given consideration. As we outline in “Addressing the Intricacies of the Dividend Cushion Ratio,” there are certain dynamics that will always be unpredictable when it comes to dividend analysis – not the least of which is human nature via board decision-making.
For insight into the processes behind our dividend report update cycle, let’s have a look at the changes behind two well-known dividend/distribution payers within our coverage universe and explain our views on them, taking into consideration not only the Dividend Cushion methodology but also firm-specific business fundamentals and a variety of other considerations. We think the following two examples are important to walk through because they provides a lens into some of the analytics behind the discounted cash-flow model and Dividend Cushion ratios that influence the valuation and dividend-health assessments we provide on companies in our coverage.
Starting to Get Concerned About Omega Healthcare’s Lofty Yield
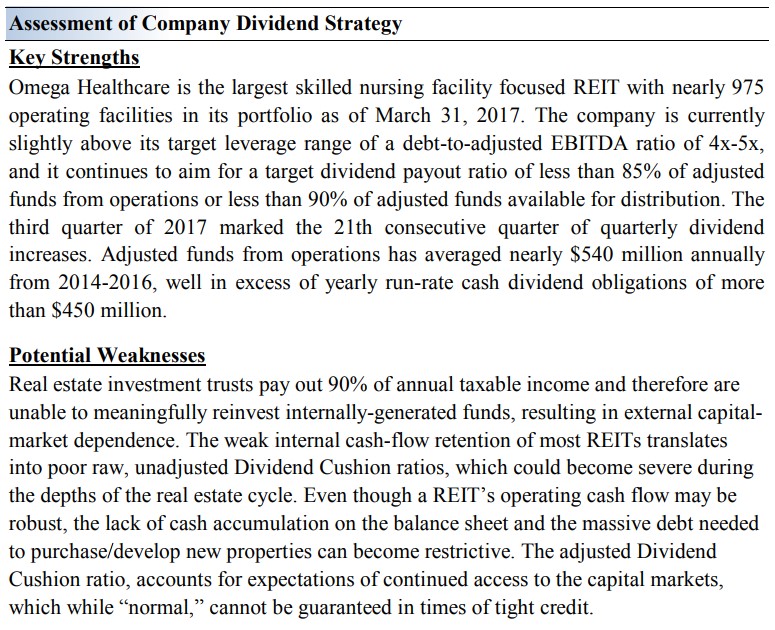
Image Source: Valuentum
Upon our most recent report update on healthcare REIT Omega Healthcare (OHI), we lowered our fair value estimate for shares as a result of reduced near-term expectations within our discounted cash-flow framework. The reduction was driven largely by issues related to one of Omega’s top-ten operators, Orianna Health Systems, which has had its lease agreements placed on a cash basis, meaning Omega will only recognize revenue related to Orianna facilities when payment is received. For example, no funds from operations (FFO) were recognized from Orianna facilities in the third quarter of 2017. This, along with other impairments related to the struggling operator, have impacted recent results and near-term FFO guidance (and our expectations, too). Omega is working to shift Orianna-operated facilities to another operator as occupancy rates have not fared well at those facilities. As of the third quarter of 2017, Orianna accounted for ~5% of Omega's annualized rent/interest.
Regarding Omega's dividend health, we continue to be of the opinion that its distribution remains dependent on access to capital markets, a characteristic that is made evident by its unadjusted Dividend Cushion ratio being in negative territory (-0.18 at the time of this writing). We’re also growing concerned that Omega’s dividend yield is approaching 10%, which is a huge red flag given deteriorating fundamentals. The REIT does have some financial flexibility in the near term, which should help with portfolio improvements and other capital needs, as it has no material debt maturities until 2022 and $905 million available on its revolving credit facility. It is also worth noting, however, that Omega's debt-to-adjusted EBITDA ratio (on an annualized basis) sat at 5.08x as of the third quarter of 2017, slightly above its target of 4.0x-5.0x. Our reports on the healthcare REIT space can be accessed at the following link: https://www.valuentum.com/articles/20120427_1
Holly Energy Partners’ Weak Balance Sheet Not the Greatest
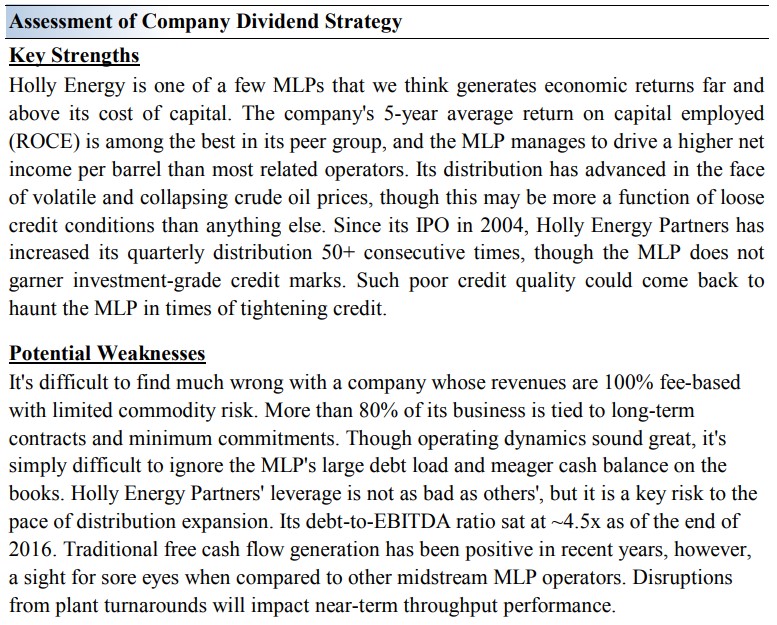
Image Source: Valuentum
Our most recent update of master limited partnership Holly Energy Partners (HEP) included a change in opinion on its dividend safety and growth potential. While our underlying firm-specific operating assumptions were largely unchanged from the previous update, free cash flow continues to be very tight in covering our expectations for future annual distribution obligations, which we expect to grow ~8% annually moving forward in the near term. Adding further pressure to Holly Energy’s dividend safety and growth profile is its generally weak balance sheet; the MLP’s credit rating is in non-investment grade territory, “Moody’s downgrades Holly Energy Partners’ notes (September 2017).”
Though we continue to expect distribution growth to continue, by definition, however, higher distribution obligations mean investors should be a little more cautious, too -- hence, we’re now much more conservative of our view on the entity’s long-term distribution health, which also spills over into our assessment of dividend growth, too. In our most recent update, for example, the adjusted Dividend Cushion ratio for Holly Energy Partners, which takes into account our expectations for new capital issuance, dropped slightly from 1.3 to 1.2, and we deem the recent increase (and expected future increases) of distribution obligations relative to internally-generated cash flow expectations to have reached a tipping point at which income-minded investors may want to take note. Put simply, as we continue to emphasize, outside capital is often necessary to fund the ongoing growth in most MLP payouts, and Holly Energy's is no exception.
The particular notion of the importance of outside equity and/or debt capital issuance is made evident by observing the MLP’s unadjusted Dividend Cushion ratio, which currently sits in negative territory (-0.42 at the time of this writing). This measure does not give the MLP credit for outside capital, meaning it is a pure assessment of the free cash flow the business throws off compared to projected cash distribution obligations, and taking into consideration its net debt position. Though Holly Energy may continue to have ample access to outside capital in the near term, should this dynamic change for any reason we would expect its distribution to pay the price, especially considering its rather poor credit rating.
Wrapping Things Up
All things considered, both Omega Healthcare and Holly Energy Partners may very well be able to continue growing their respective payouts for the foreseeable future. However, we would be remiss if we did not work to highlight the inherent risks associated with the inability of such companies to cover dividend/distribution obligations with internally-generated free cash flow. This characteristic will always result in our questioning the sustainability of REIT and MLP payouts, given adequate capital-market access cannot necessarily be guaranteed into perpetuity. Remember – nothing in the stock market is guaranteed, and 2018 may make for a difficult environment for yield seekers, too.
As it relates to rising interest rates, for example, some observers are expecting four rate hikes in 2018, and while the Fed may act slowly, the trend is not the friend for less creditworthy issuers. Rising interest rates may also pressure demand for dividend-paying equities, in general, if only that it may increase the likelihood of some investors moving into lower-risk, and higher-yielding Treasury instruments. We’re watching developments closely, and though we’re not expecting the Fed to cause a disruption by aggressively raising rates, it is a risk worth noting for long-term focused, income-minded investors. There’s a lot to be aware of as an income investor these days, and unfortunately, this won’t change anytime soon.
REITs - Healthcare: HCN, HCP, HR, LTC, OHI, UHT, VTR
REITs - Retail: CONE, COR, DDR, DLR, FRT, GGP, KIM, MAC, O, REG, RPAI, SKT, SLG, SPG, SRC, TCO, WPC
Pipelines - Oil & Gas: BPL, BWP, DPM, ENB, EPD, ETP, EVEP, HEP, KMI, MMP, NS, OKS, PAA, SE, SEP, WES