
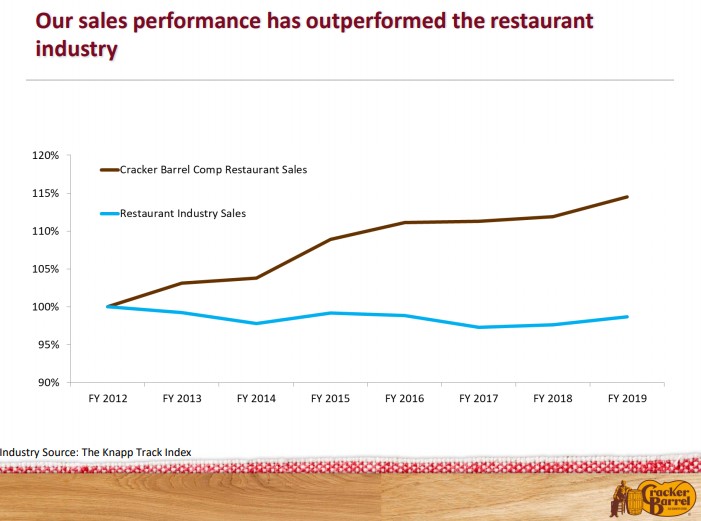
Image Source: 2019 Annual Shareholder Meeting, November 21. Although the restaurant business continues to face pressures, Cracker Barrel’s fundamentals have outperformed.
By Brian Nelson, CFA
The month of October was not kind to many in the restaurant business. While restaurant same-store sales advanced 0.06% in October, according to data from TDn2K, comparable traffic fell 3.1% during the month. While comp sales for the broader restaurant industry may remain positive through the remainder of 2019 thanks to pricing growth, the problem is that to-go and off-premise sales are hurting traffic. Here’s what TDn2K had to say about that:
The erosion of guest counts remains unchanged, as restaurants rely on to-go and off-premise sales to fuel growth. Third-party delivery is playing a large part in this shift toward off-premise consumption. 86 percent of operators not currently using a third-party delivery platform are planning to implement it within the next twelve months.
Although the restaurant industry is experiencing a comp slowdown overall, Dividend Growth Newsletter portfolio idea Cracker Barrel’s (CBRL) performance continues to outpace that of the industry. During its first quarter of fiscal 2020 (ends November 1), Cracker Barrel posted comparable store restaurant sales growth of 2.1% thanks to average menu price increases of ~2.3% (average check was up 3.6%). Traffic did fall 1.5% in the quarter, but the pace of the decline was less than half of that of the industry. Comp store retail sales fell 0.9% from the prior-year period.
During the quarter, Cracker Barrel’s operating income leapt 2.7% thanks in part to a modest improvement in the operating margin. On a comparable basis, adjusting for a couple acquisition-related items, earnings per share came in at $2.15, up from $1.96 per share in the prior-year period. The company repurchased $14.2 million in shares during the period, helping the adjusted EPS comparison.
Looking ahead to all of fiscal 2020, Cracker Barrel expects comparable store restaurant sales of 2%, comparable store retail sales of 1%, and GAAP diluted earnings per share in the range of $8.50-$8.65. Adjusting for the expected loss from Punch Bowl Social and transactional and integration expenses associated with Maple Street Biscuit, adjusted earnings are targeted at $9.45-$9.60 per share.
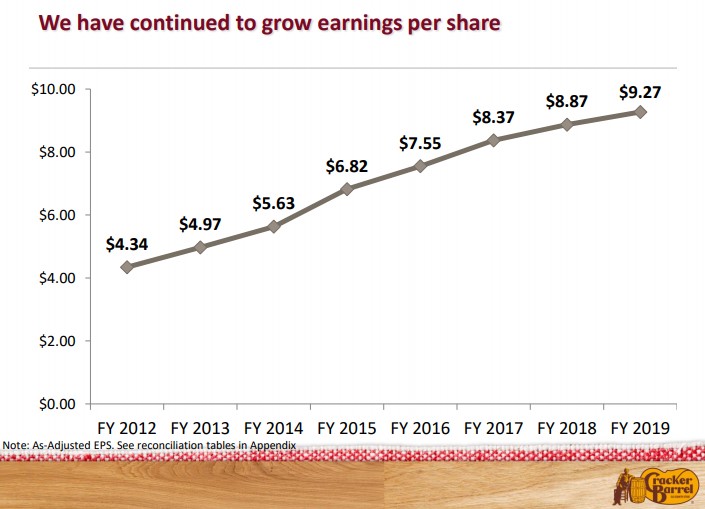
Image Source: 2019 Annual Shareholder Meeting, November 21. Cracker Barrel’s earnings per share performance has been strong during this cyclical upswing. Adjusted earnings per share is expected to advance in fiscal 2020, too.
Concluding Thoughts
First-quarter fiscal 2020 results at Cracker Barrel were solid, but the fiscal year is still early, and the restaurant industry backdrop for traffic isn’t as strong as it once was. That said, we expect Cracker Barrel to keep raising menu prices to drive strong comparable store sales performance, which should help the firm achieve operating-margin guidance of 9% during the fiscal year, propelling copious free cash flow generation and supporting capital-return efforts.

Image Source: 2019 Annual Shareholder Meeting, November 21. Cracker Barrel continues to return cash to shareholders in the form of regular dividends, special dividends, and share repurchases.
That said, we’ll be watching traffic performance and cost pressures closely in the coming quarters, but for now, our discounted cash-flow derived fair value estimate of $168 per share stands, reflecting about 17.5x the high end of the firm’s adjusted earnings per share target during fiscal 2020. Cracker Barrel’s Dividend Cushion ratio remains a very healthy 1.5x. Shares yield 3.4% at the time of this writing, and this excludes any special dividends that shareholders have grown accustomed to during the past five years.
Restaurants – Fast Food & Coffee/Snack: ARCO, DPZ, DNKN, JACK, MCD, PZZA, SBUX, WEN, YUM
Related: QSR, PEJ, PBJ
—–
Valuentum members have access to our 16-page stock reports, Valuentum Buying Index ratings, Dividend Cushion ratios, fair value estimates and ranges, dividend reports and more. Not a member? Subscribe today. The first 14 days are free.
Brian Nelson does not own shares in any of the securities mentioned above. Some of the companies written about in this article may be included in Valuentum’s simulated newsletter portfolios. Contact Valuentum for more information about its editorial policies.